What am I looking at?
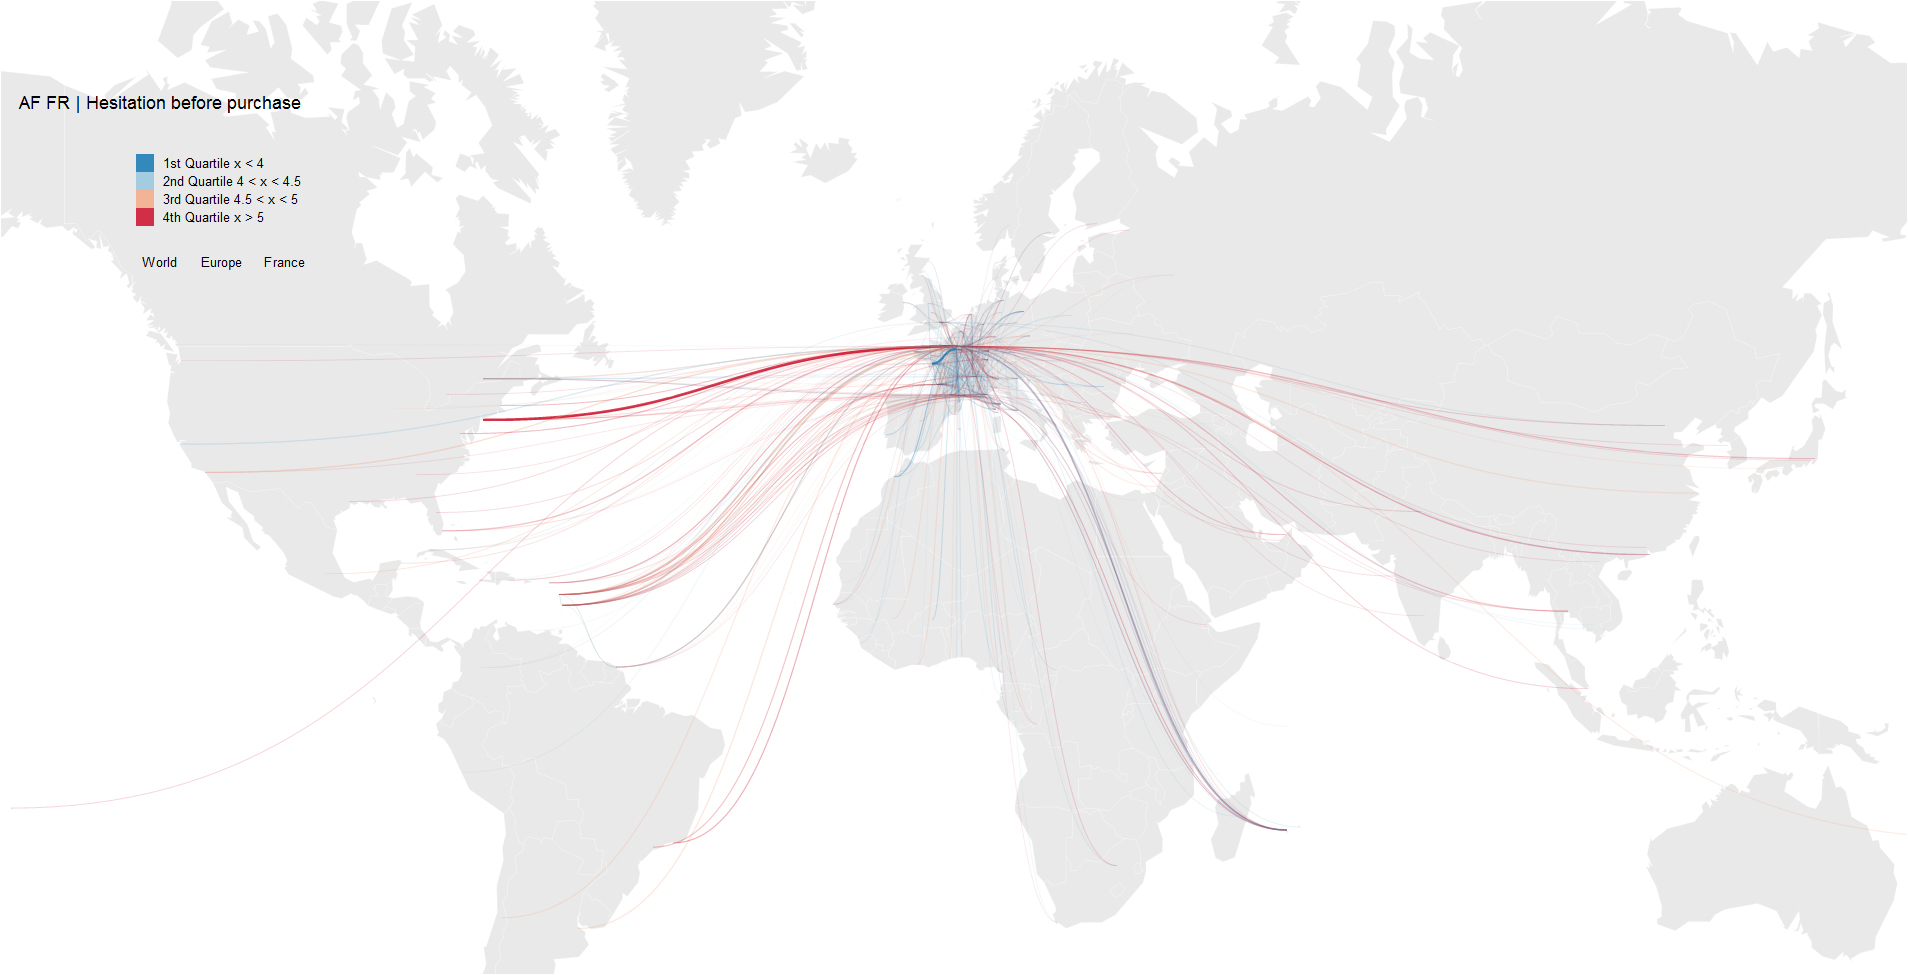
This is a real time visual representation of visitors hesitation before buying a flight tickets on an airline website.
Flight Map
Overview
This visualization displays for each route visitors hesitation before buying a flight ticket. Only routes with sufficient data are displayed.
A gradient color (blue to red) indicates the hesitation index for a particular route, i.e.: a high-hesitation index route is red. A low-hesitation index route is blue.
The Hesitation index is based on the average number of sessions before a visitor purchase a flight ticket.
Legend
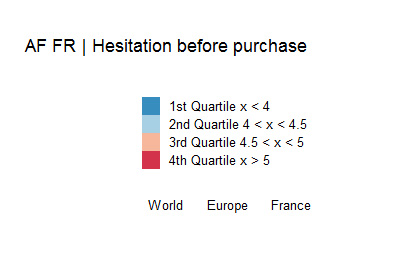
Hesitation index color encoding is as following:
Zoom
Three geographic levels are available (World, Europe and France).
To zoom on a particular geographic area, click on the corresponding area.
Lines
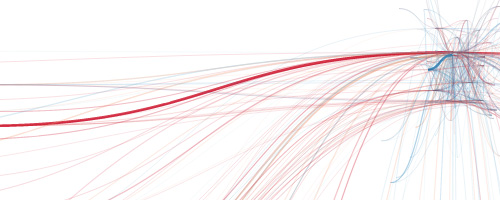
Within the map each route is shown as line linking the origin and the destination of the route.
Lines are encoded according to the Hesitation index color encoding
The thickness and the opacity of the line are proportional to the revenue of the route. The thicker and darker the bar, the higher the revenue
Showing one route only
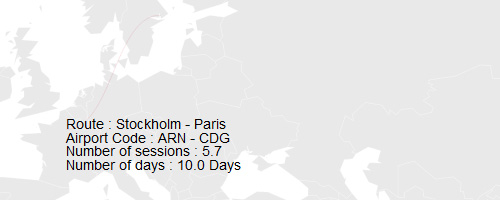
To display additional information for a particular route, click on a specific line.
Only the selected line is displayed as well as additional information such as Route, airport codes, number of sessions and number of days before purchase and revenue.
To unselect the route, double-click on the background.
Data
Hesitation index is calculated on web-analytics information collected by 55.
For each route, a Hesitation index is calculated based on the number of sessions that separates the first session and the session where the flight ticket is bought.
Dataset is refreshed every week for the last 30 days.
Disclaimer
This visualization is developed using D3. D3 is free and open-source, provided under the BSD License. It uses JavaScript and SVG for web-native visualizations; no plugin required though you will need a modern web browser!
Credits