What am I looking at?
This is a visual representation of 2xmoinscher product correlations. Three visualizations are available :
- Cross and Up Sell: all products correlation are displayed.
- Up Sell: only products that visitors saw together are displayed.
- Cross Sell : only products that visitors bought or added to basket together are displayed.
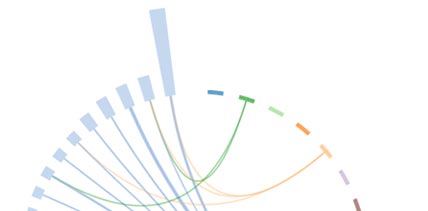
Correlation Wheel (product - category)
Overview
This visualization displays the correlation of the top 25 products of 2xmoinscher categories to other products. Only categories that have enough correlations (more than 10) are displayed.
A correlation wheel displays product - category correlations where a node-link tree shows product - product correlations.
A product can be correlated up to five other products.
Selector
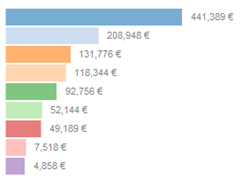
A bar graph shows the revenue of each category during the period. Each category has a unique color.
To start the visualization, select one category.
Bars
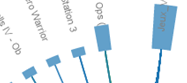
Within the correlation wheel, each product or correlated category is shown as a bar. The height of the bar is proportionnal to the revenue generated over the period :
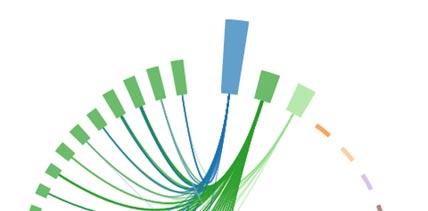
Lines
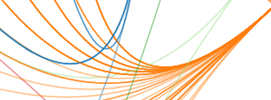
Each line represents a link between a product and a category. The color of the line corresponds to the correlated category. The width and the opacity of each line corresponds to the correlation index.
The darker and the thicker the line, the higher the correlation
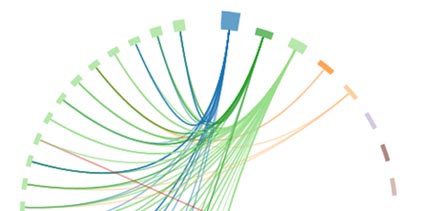
Showing one product only
Mouse over on a product to display only product - category links and link-tree product - product details.
Correlation tree (product - product)
Branch
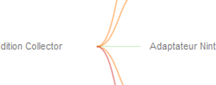
Each branch displays the link between a product with another.
The color of each line corresponds to the correlated category. The width and the opacity of each line corresponds to the correlation index.
The darker and the thicker the line, the higher the correlation
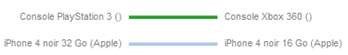
Index

Index bars give the corresponding correlation index.
The darker and the larger the bar, the higher the correlation
Top 25 correlated products
In order to display top 25 products of all categories, press space key
The top 25 correlated products are shown by descending index. As for the correlation tree, each link represents a correlation between a product and another.
The darker and the thicker the line, the higher the correlation
Data
Correlation indexes are calculated on web-analytics information collected by 55.
Three indexes are calculated:
- View Index : when a visitor sees product A and B in a row, View Index (A,B) = 1
- Cart View Index : when a visitor adds to basket two product A and B, Cart View Index (A,B) = 5
- Conversion Index : when a visitor buys two product A and B, Conversion Index (A,B) = 20
Disclaimer
This visualization is developed using D3. D3 is free and open-source, provided under the BSD License. It uses JavaScript and SVG for web-native visualizations; no plugin required though you will need a modern web browser!
Credits